Looking to include an interactive timeline in your website? Consider InteractiveTimelineJS, a starter template I built to help you build an interactive timeline for your next web project. Learn more about InteractiveTimelineJS >
Re-imagine an interactive and animated experience for the web to display events on a timeline.
Client — Academic Project
Project title — Interactive Typography Timeline
Duration — 1.5 months
Technology — HTML/CSS/JS, Leaflet.js
Background & Concept
Data-driven design is becoming a major part of design, especially in web-based applications. JavaScript libraries such as D3.js and Leaflet make possible the creation of complex and interactive projects built to present data. This project explores how a timeline could be built as an interactive web application, using modern web technologies including HTML, CSS, and JavaScript, to create a rich, dynamic, and interactive experience.
Strategy
The approach for this project looked at taking advantage of the interactive possibilities of a web application to allow for progressive disclosure of content. Unlike traditional print and other non-interactive timelines, information could be revealed to the user as the user shows interest in a certain period of time. This method of progressive disclosure also ensures the visual display does not appear crowded with content at any time, something which is traditionally a challenge in print-based timelines.
Research
With the strategy chosen to research how interactive design could be used to visually organizing the content, I chose to first explore how other web applications organize large amounts of data. Initially, I found there was one other web platform for creating interactive timelines for the web, TimelineJS.
After further exploration, the one platform which immediately drew my attention was interactive maps. With a user experience unlike most other interactive applications, interactive maps, such as Google Maps, begin with a concept of viewing everything at a high level—a world view. Once a request for more detailed is submitted through a search tool, the application can the zoom in the specific area of the map to show a specific address, point of interest, or coordinate. How information was presented was also worth noting: points of interest increase in specificity as the user zooms in. At the highest level of a worldview, markers on the map only show continent names and the names of large countries. As the user begins to zoom, more country names are revealed and large natural points of interests such as parks and mountain ranges are then shown. Further zooming in, major cities then become revealed, then major roadways, until finally business names and surface streets are fully labeled. This unique approach of progressive disclosure was one I saw could also be used for an interactive timeline.
Design Solution
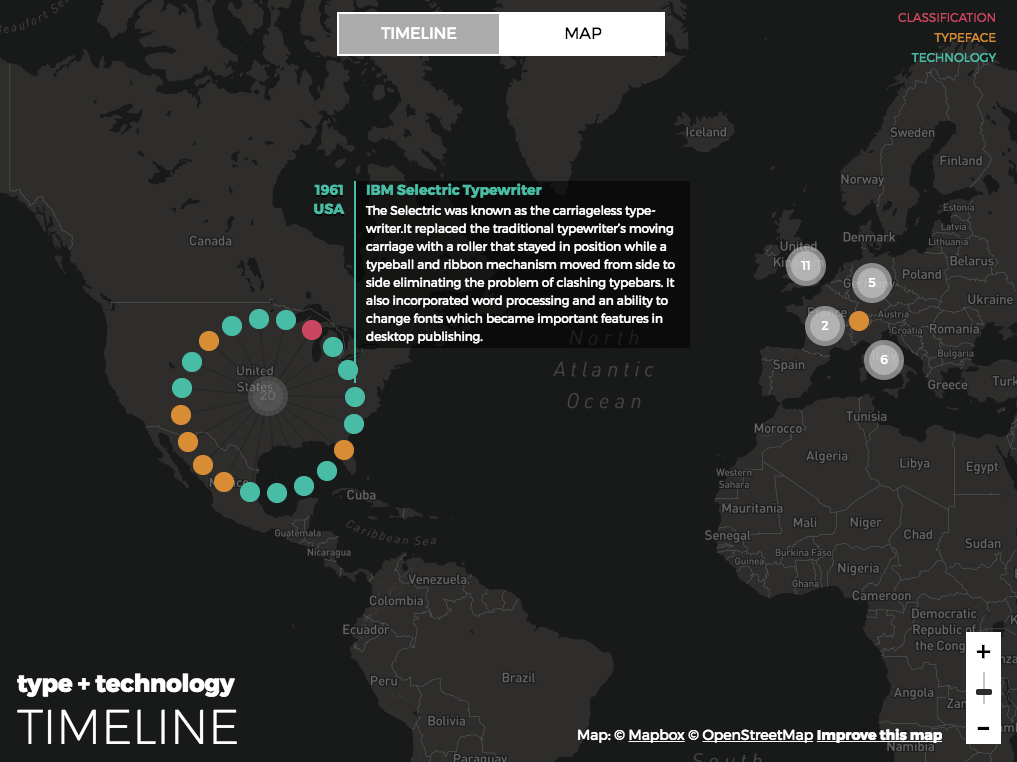
Looking at interactive maps as the inspiration, I chose to present all the events of typographic history on one horizontal timeline. The user begins by seeing the time period of 1100–2100, which encompasses all the events represented. Each event is represented as a circle on the timeline. For events which occur near other events in chronological order, a “grouped” icon is represented instead of the events. For example, an event in 1730 and 1757 is replaced by one gray circle labeled with the number 2. This numerical number describes the amount of events grouped. A user can the selected an individual event circle to reveal a popup detailing the name of the event, the year of the event, and a description of the event. If a grouped icon is selected, the user is zoomed in to that time period on the timeline. For example, if the grouped icon mentioned earlier is selected, the user is automatically zoomed in to the 1730 to 1760 time period. From here the user can then select one of the events.

Users may also zoom and pan the timeline much like an interactive map like Google Maps: scrolling, using the zoom slider in the bottom right, or pinching open to zoom on a touch-screen device, will zoom into the timeline. Similarly, clicking and dragging will pan across the timeline.
Additionally, the events represented on the timeline were also presented on an interactive geographical map, making possible the viewing of where each event occurred.
Challenges
The primary challenge to this design solution is the technological implementation. After research of several JavaScript libraries, I chose to use a JavaScript library originally built for displaying interactive maps, since my interactive design approach was most similar to that of interactive maps. Leaflet, a popular JavaScript library, is used by website such as Facebook, the U.S. National Parks Service, and The Washington Post for displaying geographical data on an interactive map and was the JavaScript library chosen for this project.
Additional Information
This project is built on several open-source technologies. A complete list of these are listed below, along with their license information.
- jQuery | MIT License
- Leaflet| BSD License
- Leaflet MarkerCluster | MIT License
- Leaflet ZoomBox | ISC License
- Leaflet ZoomSlider | BSD-2 License
- RBrush | MIT License
This project also uses map tiles from Mapbox. These map tiles are ©Mapbox and ©OpenStreetMap. More information can be found at mapbox.com/about/maps and openstreetmap.org/copyright.
Looking to include an interactive timeline in your website? Consider InteractiveTimelineJS, a starter template I built to help you build an interactive timeline for your next web project. Learn more about InteractiveTimelineJS >

You must be logged in to post a comment.