This project includes the HTML, CSS, JavaScript, and needed libraries to get started on adding a beautiful, interactive, and customizable timeline to your web project.
Features:
- Zoom and pan timeline
- Year markers: customize start and end year
- Define events to the date (YYYY-MM-DD)
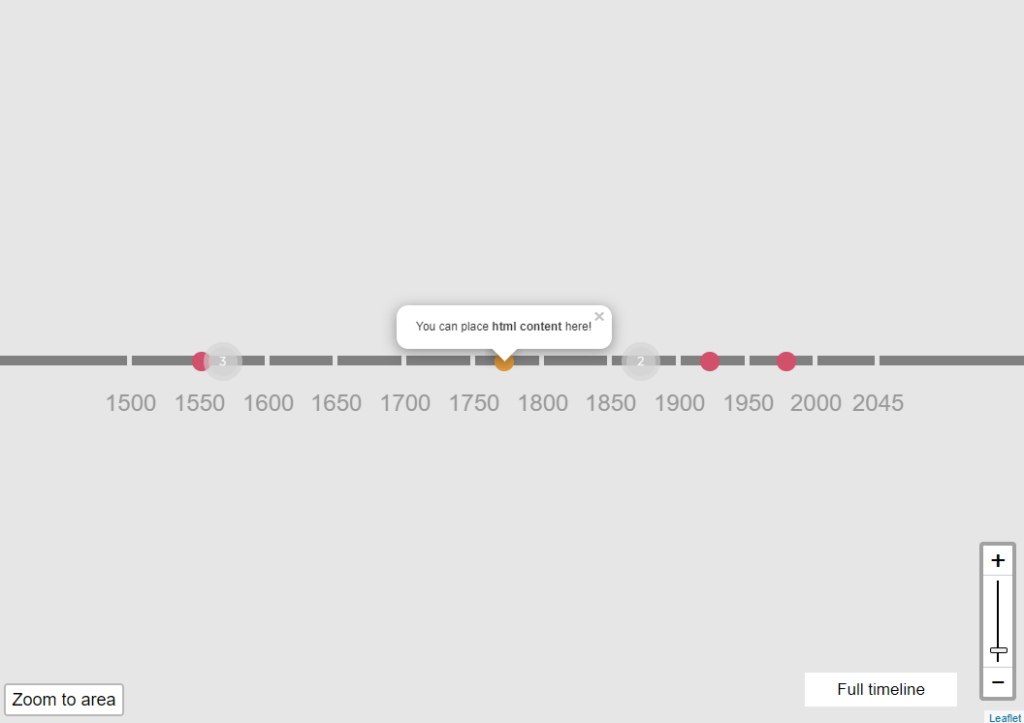
- Events when clicked open a popup with content you set in HTML
- Events near each other on the timeline will display as a clickable “cluster” to reduce clutter on the timeline
- Click the “Full timeline” button at anytime to return to the overview
- Click “Zoom to area” and click and drag an area of the timeline to zoom to
- Mobile and touch compatible
Video
Preview
Instructions on use
Adding your own data
Events on the timeline are entered as JSON array using the following format. You can view the sample below (found in the main.js file). In summary, an event on the timeline requires three elements in the array: date (formatted as YYYY-MM-DD), a PNG icon’s path, and the html content of the popup.
dataset = [
     //[date in YYYY-MM-DD, path to image for icon, html content for popup]
     ["1550-01-01","icon1.png","Popup text"],
     ["1570-05-01","icon1.png","Popup text"],
     ["1560-02-12","icon1.png","Popup text"],
     ["1870-05-01","icon1.png","Popup text"],
     ["1870-05-01","icon1.png","Popup text"]
]
Initializing the timeline
The timeline is initialized with the function initializeInteractiveTimeline(), (found in the main.js file). This function requires the following properties to be set:
initializeInteractiveTimeline({
       containerId: "container", // id of div of where the timeline is
       startYear: 1500, // earliest year shown in the timeline
       endYear: 2050, // latest year shown in the timeline
       minZoom: 0, // the minimum zoom level
       maxZoom: 9.5, // the max zoom level
       zoomDelta: 0.5, // the delta when zooming in/out
       dataset: dataset // the JSON array with the events data

})
Customize the colors and style of the timeline
Much of the timeline’s colors and style can be customized by modifying or adding CSS styles in the interactivetimeline.css.
Common elements to customize:
- Change timeline background: edit the background-color of #container
- Change the color of the timeline: edit the background-color of .leaflet-marker-icon.timeline-part
- Change the color of the year lines: edit the background-color of .leaflet-div-icon
- Change the color and font of the year text: edit the CSS of .dateLabel
- Change event markers: these are PNG images defined in the dataset array; replace with your own image. Recommended size of 20px by 20px
- Change the style of popups: edit the CSS of .leaflet-popup-content-wrapper
Files included
- index.html – the base webpage
- main.js – the main JavaScript file, where the dataset is defined and initializeInteractiveTimeline() is called. You may add your own JavaScript code here
- interactivetimeline.js – the core of the InteractiveTimelineJS library
- interactivetimeline.css – CSS for InteractiveTimelineJS. Modify or add to this file to customize the look of the timeline
- leafletpackage.js – A combination of the third-party open source libraries needed
- leafletpackage.css – A combination of the third-party open source CSS
- icon1.png – the default event marker icon
Open Source Licenses
InteractiveTimelineJS uses code from the following open source libraries:
- Leaflet | BSD License
- Leaflet MarkerCluster | MIT License
- Leaflet ZoomBox | ISC License
- Leaflet ZoomSlider | BSD-2 License
- RBrush | MIT License
- Leaflet.LayerGroup.Collision | MIT License
Pricing
Payments are securely processed by Stripe.
You must be logged in to post a comment.